Google Pie chart gets unformatted when called by Javascript function
Hello, guys. I am having problem rendering a graph that is with "display: none" in "display: block" via Javascript. The problem is that when I turn the chart visible it gets smaller than expected.
The graph is getting this resolution
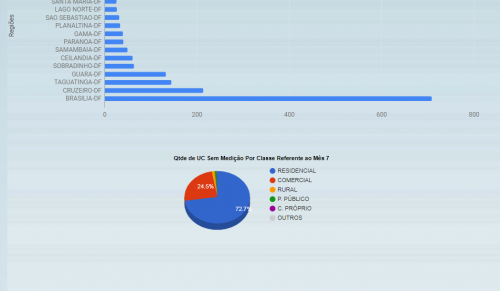
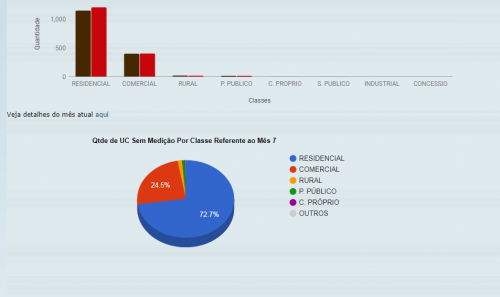
When should I stay with this resolution
Below is the code of the graph in question
Code html
<div id="relat_sit_table" style="display:none;">
<div class='tab_title'>Situação UC Sem Medidor <?php echo "($mees/$anoo)"; ?></div><br/>
<div id='table_div_estilo2'><br/>
<div id='table_div3'></div></div><br/>
</div>
<div id="relat_sit_det2" style="display:none"><p class="relat_sit_det2"> Veja comparação entre os últimos meses <a href="#" name="relat_sit2" onClick="optionCheck4()">aqui</a></p></div>
Javascript
function optionCheck1(){
      document.getElementById("columnchart_material_2").style.display ="none";
      document.getElementById("piechart").style.display ="block";
      document.getElementById("relat_class_det1").style.display ="none";
      document.getElementById("relat_class_det2").style.display ="block";
            }
1 answers
This is because the API may not properly scale the graph in hidden div, getting incorrect values of the container dimensions.
One way around this is by removing the visibility of div (other than hide) with the property visibility: hidden and position: absolute so that the empty space of div is not invisible.
When calling the function to show it, change visibility to visible and position to relative.
In the div of the chart place the style:
style="visibility: hidden; position: absolute;"
And change in function with:
document.getElementById("ID_DA_DIV").style.position = "relative";
document.getElementById("ID_DA_DIV").style.visibility = "visible";