How can I track the execution time of each of the functions and the total execution time of the program
There is a code with three sotrirovkami, there is a report on the execution time of the program. How can I track the execution time of each of the functions and the total execution time of the program. Also, if it is not difficult, advise how to shorten the program.
import numpy
import time
start_time = time.clock()
def selection(arrayToSort):
    a = arrayToSort
    for i in range(len(a)):
        idxMin = i
        for j in range(i+1, len(a)):
            if a[j] < a[idxMin]:
                idxMin = j
        tmp = a[idxMin]
        a[idxMin] = a[i]
        a[i] = tmp
    return a

def insertion(arrayToSort):
    a = arrayToSort
    for i in range(len(a)):
        v = a[i]
        j = i
        while (a[j-1] > v) and (j > 0):
            a[j] = a[j-1]
            j = j - 1
        a[j] = v
    return a

def bubble(arrayToSort):
    a = arrayToSort
    for i in range(len(a),0,-1):
        for j in range(1, i):
            if a[j-1] > a[j]:
                tmp = a[j-1]
                a[j-1] = a[j]
                a[j] = tmp
    return a

ary = numpy.random.choice(100000, 100000, replace=False)
print (len(ary), ary[:5])
print (len(selection(ary)), selection(ary)[:5])
print (len(insertion(ary)), insertion(ary)[:5])
print (len(bubble(ary)), bubble(ary)[:5])
print ("{:g} s".format(time.clock() - start_time))
4 answers
To measure the execution time of a program, you can use the time command (often embedded in the shell):
$ time python -c 'import time; time.sleep(1)'
python -c 'import time; time.sleep(1)'  0.01s user 0.00s system 1% cpu 1.021 total
If the command is not available, it can be implemented in Python.
To see how long individual functions take, you can cProfile module use:
$ python -m cProfile -s time your_module.py
In graphical form, the results are conveniently viewed in KCachegrind. Example of commands. More options: How can you profile a script?
line_profiler allows you to make a line-by-line comparison.
Content:
- timeit
- reporttime.py
- make-figures.py
- reporttime + pandas
Timeit
To measure the performance of an individual function, you can timeit module use:
$ python -m timeit -s 'from insertion_sort import sorted; L = list(range(10**5))' 'sorted(L)'
The same interface provides pyperf module (in addition to other things):
$ python -m pyperf timeit -s '...' 'sorted(L)'
The documentation states that pyperf more reliable results are given by.
For interactive work, you can %timeit magic in ipython/jupyter notebook use.
Reporttime.py
When optimizing the execution of a function, you should make sure that it works correctly (tests), that changes really accelerated its work (performance comparison). To do this, you can pytest-benchmarkuse.
For the convenience of comparing the performance of several algorithms, you can automatically collect the corresponding functions by a common prefix in the name (get_functions_with_prefix()). For example, if the functions in the question can be called: sorted_selection, sorted_insertion, sorted_bubble and put it in the daedra.py file:
#!/usr/bin/env python
import random
from reporttime import get_functions_with_prefix, measure
import daedra

funcs = get_functions_with_prefix('sorted_', module=daedra)
for comment, L in [
        ("all same", [1] * 10**3),
        ("range", list(range(10**3))),
        ("random", list(range(10**3)))]:
    if comment == "random":
        random.shuffle(L)
    measure(funcs, args=[L], comment=comment)
Where reporttime.py. The measure() function measures the performance of functions in a similar way to the python -mtimeit command.
Results
name                  time  ratio comment
sorted_insertion  184 usec   1.00 all same
sorted_selection 55.9 msec 303.86 all same
sorted_bubble    59.4 msec 322.92 all same
name                  time  ratio comment
sorted_insertion  186 usec   1.00 range
sorted_selection 57.7 msec 309.44 range
sorted_bubble    60.8 msec 326.40 range
name                  time ratio comment
sorted_selection   58 msec  1.00 random
sorted_insertion 66.2 msec  1.14 random
sorted_bubble     119 msec  2.05 random
Table shows that on the already sorted input sorted_insertion(), the function significantly wins (in this case, the linear time for this function is required compared to the quadratic time for sorted_selection() and sorted_bubble()). For random input, the performance is about the same. sorted_bubble() worse in all variants.
Make-figures.py
Alternatively, you can use a decorator such as @to_compare, to collect functions for comparison and adapt them for make-figures.py a script that measures performance and plots graphs. Example.
To draw the execution time of functions for different inputs:
#!/usr/bin/env python
#file: plot_daedra.py
import random

def seq_range(n):
    return list(range(n))

def seq_random(n):
    L = seq_range(n)
    random.shuffle(L)
    return L

if __name__ == '__main__':
    import sys
    from subprocess import check_call

    import daedra
    from reporttime import get_functions_with_prefix

    # measure performance and plot it
    check_call(["make-figures.py"] + [
        "--sort-function=daedra." + f.__name__
        for f in get_functions_with_prefix('sorted_', module=daedra)
    ] + [
        "--sequence-creator=plot_daedra." + f.__name__
        for f in get_functions_with_prefix('seq_')
    ] + sys.argv[1:])
seq_range(), seq_random() specify two types of input (already sorted and random, respectively). You can define additional types by defining the seq_*(n) function. Launch example:
$ PYTHONPATH=. python plot_daedra.py --maxn 1024
PYTHONPATH=. used to:make-figures.py I was able to find the plot_daedra module (with seq_range, seq_random functions) in the current directory. --maxn defines the largest n that is passed to the seq_(n) function.
Results


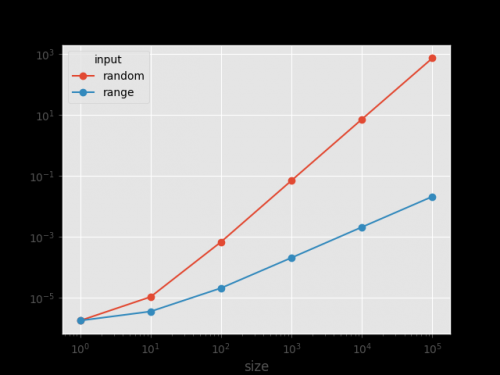
The figures confirm that sorted_insertion() shows linear behavior on sorted input (seq_range=0,1,2,3,4,...,n-1). And quadratic on random input (seq_random). The coefficient before log2(N) shows approximately the corresponding degree in the growth function of the algorithm as a function of the size input:
|------------------------------+-------------------|
| Fitting polynom              | Function          |
|------------------------------+-------------------|
| 1.00  log2(N)   +  1.25e-015 | N                 |
| 2.00  log2(N)   +  5.31e-018 | N*N               |
| 1.19  log2(N)   +      1.116 | N*log2(N)         |
| 1.37  log2(N)   +      2.232 | N*log2(N)*log2(N) |
Reporttime + pandas
By collecting the results of the sorting function execution time measurements from daedra.py (sorted_*()) for different types (already sorted/random) and input sizes (lengths from 1 to 100000):
import random
import daedra
from reporttime import get_functions_with_prefix, measure_func

times = {}  # (function name, input type, exp size) -> time it takes
for f in get_functions_with_prefix('sorted_', module=daedra):
    for N in range(6):
        for case, L in [
            ("range", list(range(10**N))),
            ("random", list(range(10**N)))]:
            if case == "random":
               random.shuffle(L)
            times[(f.__name__, case, N)] = measure_func(f, [L])
It is convenient to explore the results interactively using pandas.DataFrame:
import pandas as pd

df = pd.DataFrame([dict(function=f, input=i, size=10**n, time=t)
                   for (f,i,n), t in times.items()])
For example, to compare the behavior of functions on already sorted input:
def plot_input(input):
    p = df[df.input==input].pivot(index='function', columns='size', values='time')
    p.T.plot(loglog=True, style='-o', title=input)  # same style as in @MaxU's answer
    return p

plot_input('range')

Behavior on the random input:
plot_input('random')

Or compare the behavior of a single function for different input types on a single graph:
p = df[df.function=='sorted_insertion'].pivot(index='input', columns='size', values='time')
p.T.plot(loglog=True, style='-o', title='sorted_insertion')
import numpy
from timeit import default_timer as timer


start_time = timer()

#
# <Описание функций selection, insertion и bubble>
#

def python_sort(array_to_sort):
    array_to_sort.sort()


number = 10000
ary = numpy.random.choice(number, number, replace=False)
print(len(ary), ary[:5])
print()


def my_time_this(function):
    items = numpy.copy(ary)

    t = timer()
    function(items)
    elapsed = timer() - t

    print_format = "{:<15} {:.10f} secs. number: {}, first 5: {}"
    print(print_format.format(function.__name__, elapsed, len(items), items[:5]))


my_time_this(python_sort)
my_time_this(selection)
my_time_this(insertion)
my_time_this(bubble)

print()
print("Total elapsed: {:g} secs".format(timer() - start_time))
Console:
10000 [2961 2787 7118  974 7860]

python_sort     0.0004201819 secs. number: 10000, first 5: [0 1 2 3 4]
selection       11.4002999229 secs. number: 10000, first 5: [0 1 2 3 4]
insertion       11.0592371948 secs. number: 10000, first 5: [0 1 2 3 4]
bubble          24.4177592050 secs. number: 10000, first 5: [0 1 2 3 4]

Total elapsed: 46.8791 secs
Before each sorting, I made a copy of the array, because after the first sorting, the array would become sorted and this would prevent the following sorting algorithms from being adequately evaluated
If desired, you can slightly automate and visualize the time measurement processes:
import timeit
import numpy as np
import pandas as pd
import matplotlib.pyplot as plt
import matplotlib
matplotlib.style.use('ggplot')

def selection(arrayToSort):
    a = arrayToSort.copy()
    for i in range(len(a)):
        idxMin = i
        for j in range(i+1, len(a)):
            if a[j] < a[idxMin]:
                idxMin = j
        tmp = a[idxMin]
        a[idxMin] = a[i]
        a[i] = tmp
    return a

def insertion(arrayToSort):
    a = arrayToSort.copy()
    for i in range(len(a)):
        v = a[i]
        j = i
        while (a[j-1] > v) and (j > 0):
            a[j] = a[j-1]
            j = j - 1
        a[j] = v
    return a

def bubble(arrayToSort):
    a = arrayToSort.copy()
    for i in range(len(a),0,-1):
        for j in range(1, i):
            if a[j-1] > a[j]:
                tmp = a[j-1]
                a[j-1] = a[j]
                a[j] = tmp
    return a

def np_sort(arrayToSort):
    a = arrayToSort.copy()
    return np.sort(a)

def py_sorted(arrayToSort):
    a = arrayToSort.copy()
    return sorted(a)

res = pd.DataFrame(
    index=['selection', 'insertion', 'bubble', 'py_sorted', 'np_sort'],
    columns=np.logspace(2, 5, 4).astype(int),
    dtype=float
)

for j in res.columns:
    a = np.random.choice(j, j, replace=False)
    for i in res.index:
        stmt = '{}(a)'.format(i)
        setp = 'from __main__ import a, {}'.format(i)
        print('processing [{}]\tarray size: {}'.format(i,j), end='')
        res.at[i, j] = timeit.timeit(stmt, setp, number=50)
        print('\t\ttiming:\t{}'.format(res.at[i, j]))
print(res)

plt.figure()
ax = res.T.plot(loglog=True, style='-o', figsize=(10,8))
ax.set_xlabel('array size')
ax.set_ylabel('time (sec)')
plt.savefig('c:/temp/result.png')
Results:
             100       1000       10000        100000
selection  0.002741  0.271356  26.972909  2717.141041
insertion  0.002278  0.258578  26.933399  2644.332910
bubble     0.005418  0.566870  62.634945  5881.305021
py_sorted  0.000066  0.000689   0.008864     0.112469
np_sort    0.000298  0.000313   0.001023     0.012551
Result.png:

This is how you can measure the running time of several functions:
import time

def func1():
    ...

def func2():
    ...

tasks = [func1, func2]
for func in tasks:
    t = time.time()
    func()
    print(f"{func.__name__}: {time.time()-t}")