How to configure xdebug + phpstorm on a remote server
What I did for this.
-
To begin with, I installed xdebug on the server. on centos 6, I installed the extension
Yum install php-pecl-xdebug.x86_64
2.configured php. ini
zend_extension = /usr/local/ioncube/ioncube_loader_lin_5.6.so
zend_extension_ts = /usr/local/ioncube/ioncube_loader_lin_5.6_ts.so
zend_extension = /usr/lib64/php/modules/xdebug.so
xdebug.remote_enable = 1
xdebug.remote_host = myIP
xdebug.remote_port = 9000
xdebug.remote_handler = dbgp
xdebug.remote_connect_back = 1
xdebug.remote_autostart=on
xdebug.idekey = "PHPSTORM"
VESTA is installed on the server, as you can see from the records, ion_cube is also installed there
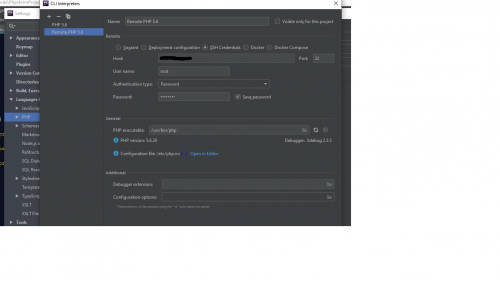
- I configured the remote interpreter on phpstorm
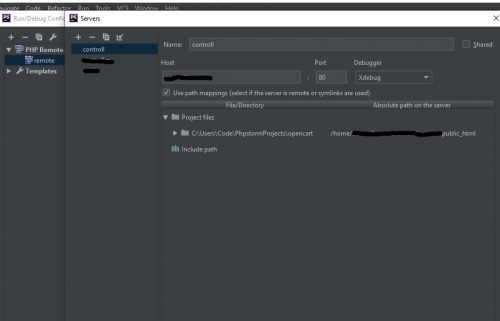
- Created a server
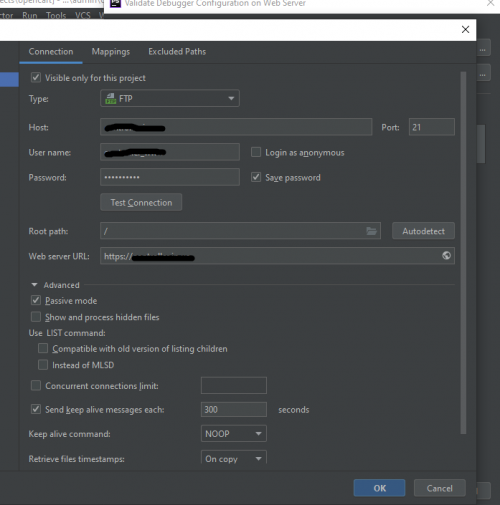
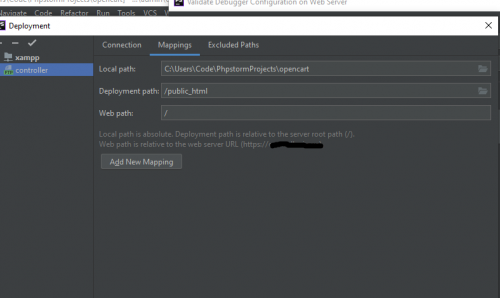
5 Added Deployment by ftp for synchron and configured mapping
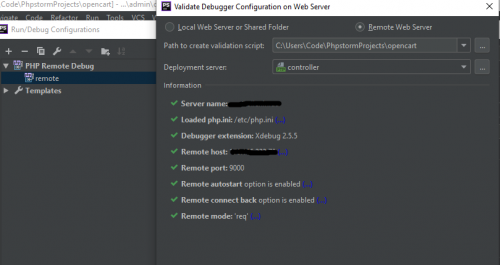
6 Checked the validation
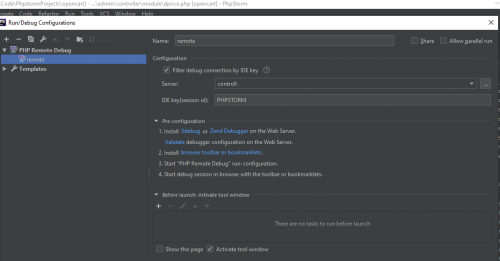
- Created a configuration for debugging
The browser already has an extension for catching the code, since it already worked on the local server.
And.... everything))) dancing with tambourines began.
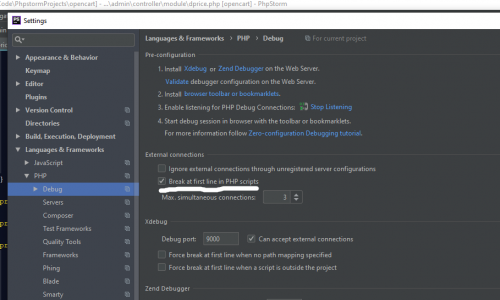
To begin with, I set Break at first line , see how it works
Reactions 0.
I dug up the entire Internet , tried. doesn't catch it. The thoughts were different, that phpstorm ignores remote php and listens to local, but the extensions have different versions, this can be seen in the screenshot, on the remote 2.5.5 on the local 2.2.5. After a couple of days of searching for the error, I remembered that I need to register the port for a secure connection 443, I was happy, I thought this is the reason, it also does not work.
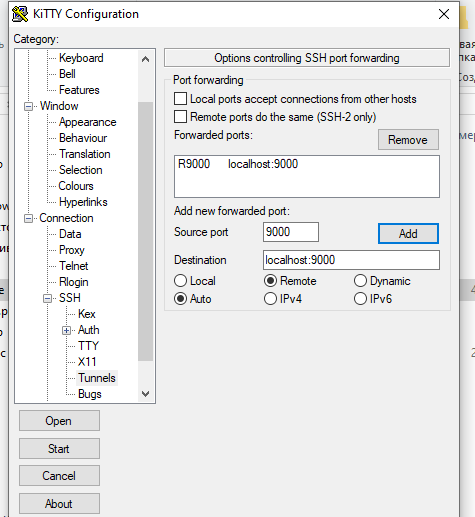
I read that phpstorm is not friendly on this issue with https, to check, I made a new project for a normal connection (there is a spare domain, installed the engine on a new site, set up, also does not work). I read about ssh tunnel. Configured the connection, in putty
 in php. ini
xdebug.remote_host = 127.0.0.1
Also does not work for me ((. Already out of desperation, I mounted the remote to myself on Windows, with the hope of running the debug as locally, but I don't quite understand how it can work, I abandoned it. I tried to configure the PHP Web Page configuration, it is also configured, but it does not catch.
Help, I really hope that the solution is somewhere nearby and I do not see it. To finally make sure that on the server side xdebug works correctly, I think how to see that the extension xdebug sends something to port 9000. However, I do not know how , I am not strong in the admin panel ((. Tell me where to dig, HELP!
1 answers
It was all the fault of the router, without port forwarding it does not work )