Peak value of a histogram
My Code reads an image and makes the transformation of the RGB color model to HSV, and then I make a frequency histogram of each channel (H, S and V), with H ranging from 0-179 and the others from 0-255. With histogram plotting it is possible to check peaks in the channels H, S and V. This histogram shows through the vertical axis the amount of pixels and the horizontal axis the channels H, S and V. I want to return the values of H, S and V where the amount of pixels is greater, or that is, the peak of the histogram of each channel.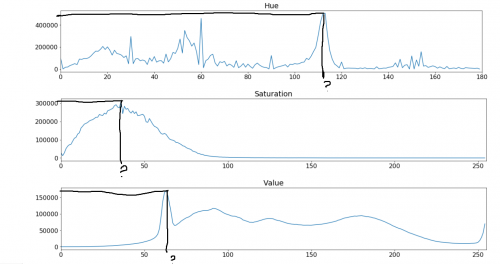 How to do this? I have already used the np method.amax() but it returns me the maximum values of each channel (H = 179, S = 255 and V =255).
def show_hsv_hist(image):
    # Hue
    plt.figure(figsize=(20, 3))
    histr0 = cv2.calcHist([hsv], [0], None, [180], [0, 180])
    plt.plot(histr0)
    plt.xlim([0, 180])
    plt.title('Hue')

    # Saturation
    plt.figure(figsize=(20, 3))
    histr1 = cv2.calcHist([hsv], [1], None, [255], [0, 255])
    plt.xlim([0, 255])
    plt.plot(histr1)
    plt.title('Saturation')

    # Value
    plt.figure(figsize=(20, 3))
    histr2 = cv2.calcHist([hsv], [2], None, [255], [0, 255])
    plt.xlim([0,255])
    plt.plot(histr2)
    plt.title('Value')

    max_v = np.amax(v)
    print (max_v)
Fashion can find out the most frequent value for each channel. Do you have any methods for this? I know there is in numpy median, average.
1 answers
The value of maximum Y and Maximum X can be found with the function max() and numpy.where
ymax = max(histr)
xmax, _ = np.where(histr == ymax)

print(xmax, ymax)
Code
import cv2
import numpy as np
import urllib.request
import matplotlib.pyplot as plt

def show_hsv_hist(hsv):
    HSV = [['Hue', 0, 180], ['Saturation', 1, 255], ['Value', 2, 255]]
    for nome, canal, valor in HSV:
        # Gráfico
        plt.figure(figsize=(20, 3))
        hist = cv2.calcHist([hsv], [canal], None, [valor], [0, valor])
        plt.plot(hist)
        plt.xlim([0, valor])
        plt.title(nome)
        #Máximo
        ymax = max(hist)
        xmax, _ = np.where(hist == ymax)
        print(ymax, xmax)

resp = urllib.request.urlopen("https://upload.wikimedia.org/wikipedia/commons/3/32/Carrots_of_many_colors.jpg")
img = np.asarray(bytearray(resp.read()), dtype="uint8")
img = cv2.imdecode(img, cv2.IMREAD_COLOR)

cv2.imshow('Original', img)
cv2.waitKey(0)

hsv = cv2.cvtColor(img, cv2.COLOR_BGR2HSV)

show_hsv_hist(hsv)
plt.show()