Program for drawing graphs of functions entered by the user or specified as strings
Hello everyone. How to create a program that draws graphs of functions in MatplotLib. I've been sketching out something:
# -*- coding: utf-8 -*-
from numpy import *
import matplotlib.pyplot as plt
import math
import pylab
from matplotlib import mlab

print("Строитель графиков")

f = input ('f(x)=')
code = """
def func (x):
    return %s
""" % f
exec(code)

xmin = -20.0
xmax = 20
dx = 0.01
xlist = mlab.frange (xmin, xmax, dx)
ylist = [func (x) for x in xlist]
plt.axis([-20, 20, -20, 20])
plt.xlabel('x')
plt.ylabel('y')
plt.title('График функции(x)')
plt.grid(True)
pylab.plot (xlist, ylist)
pylab.show()
It's alright. But as I start to touch:
code = """
def func (x):
    return %s
""" % f
Writes that there is an extra indent, but the question is: where? I want to insert a while here as well, so that I can build function graphs indefinitely, but I can't because of this.
Can you tell me how to make it so that I can endlessly build graphs of functions?:)
Who has what options?
1
1 answers
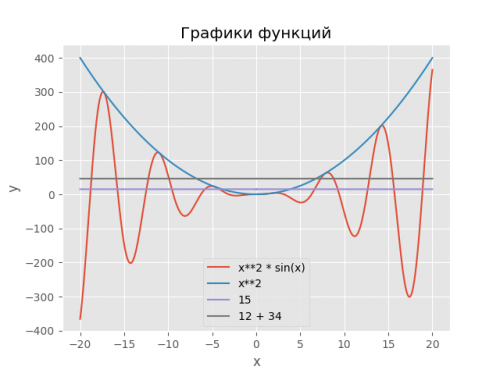
UPDATE: plotting all the functions at once. Functions that do not have the x variable (for example, f(x) = 5 + 20) will be converted to the form: f(x) = x/x * (5 + 20)
# -*- coding: utf-8 -*-
import numexpr as ne
import matplotlib.pyplot as plt
from matplotlib import mlab

plt.style.use('ggplot')

xmin = -20.0
xmax = 20
dx = 0.01
x = mlab.frange(xmin, xmax, dx)

funcs = ["x**2 * sin(x)", "x**2", "15", "12 + 34"]

# преобразовуем функции, в которых отсутствует переменная `x` к виду: `x/x * (5)`
new_funcs = [f if 'x' in f else 'x/x * ({})'.format(f) for f in funcs]

[plt.plot(x, ne.evaluate(f), linewidth=1.5) for f in new_funcs]
plt.title('Графики функций')
plt.xlabel('x')
plt.ylabel('y')
plt.legend(funcs)
plt.show()
Converted functions:
In [25]: new_funcs
Out[25]: ['x**2 * sin(x)', 'x**2', 'x/x * (15)', 'x/x * (12 + 34)']
PS I should also add exception handling, but I'm too lazy...
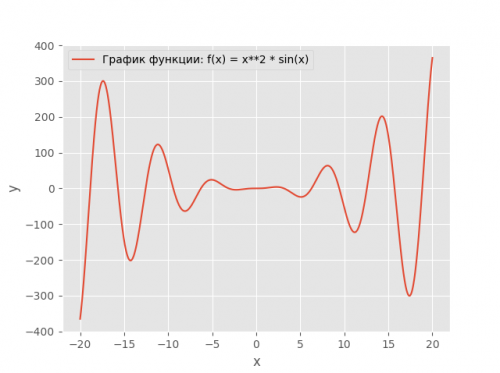
Previous answer:
Use the numexpr :
# -*- coding: utf-8 -*-
import numexpr as ne
import matplotlib.pyplot as plt
from matplotlib import mlab

plt.style.use('ggplot')

xmin = -20.0
xmax = 20
dx = 0.01
x = mlab.frange(xmin, xmax, dx)

# f = input ('f(x)=')
f = "x**2 * sin(x)"
plt.plot(x, ne.evaluate(f), linewidth=1.5)
plt.xlabel('x')
plt.ylabel('y')
plt.legend(['График функции: f(x) = {}'.format(f)])
plt.show()
1
Author: MaxU, 2017-03-23 16:27:27